Yesterday we saw a How to Debug PS4 Applications via PS4GDB Desktop Tutorial from PS4Scene developer m0rph3us1987, and today he's back as promised via Twitter with a brief guide covering How to Trigger RING0GDB to Debug PS4 Kernel on PlayStation 4 with the precompiled triggerRING0.bin kernel payload below. 
Download: triggerRING0.bin (16.2 KB) / triggerRING0-master.zip / GIT
 For those new to the PlayStation 4 Scene, below are some previous articles of interest (sorted by date with the oldest first):
RING0GDB is a gdbstub that gives you the ability to debug your ps4 kernel using gdb. Like PS4GDB it's integrated into Mira and starts in the background as soon as you load Mira.
In the next sections I will show you what steps are needed to get started.
How to trigger RING0GDB
RING0GDB is automatically started during the loading process of Mira. From a technical point of view, it does not really get started, but installation happens by overwriting two ISRs (Interrupt Service Routine). We overwrite the routines for INT1 (debug) and INT3 (breakpoint).
This means that as soon as one of these two interrupts get fired, RING0GDB takes control and allows us to connect to it with gdb just like we can do for PS4GDB.
Example debugging exec_self_imgact
exec_self_imgact is responsinble for loading/starting executable files on the ps4. So our goal is to set a breakpoint into this function, and debug it as soon as it gets called by the kernel.
Like mentioned before, we must trigger one of the two interrupts. This can be easily achieved by running a kernel payload that looks like this:
In this repository you can find a precompiled binary triggerRING0.bin which contains this code.
At this point the ModuleLoader i've added to Mira comes very handy. Because we can send this binary to port 9025 and it will start RING0GDB for us.
As soon as we send the payload to port 9025 klog should show us something like this:
At this point RING0GDB is waiting for gdb to connect on port 9946.
Like I did for PS4GDB, I've created a file (kernel.source) with the necessary commands gdb should execute at launch, the file looks like this:
Remember to replace the ip address with the ip address of your ps4.
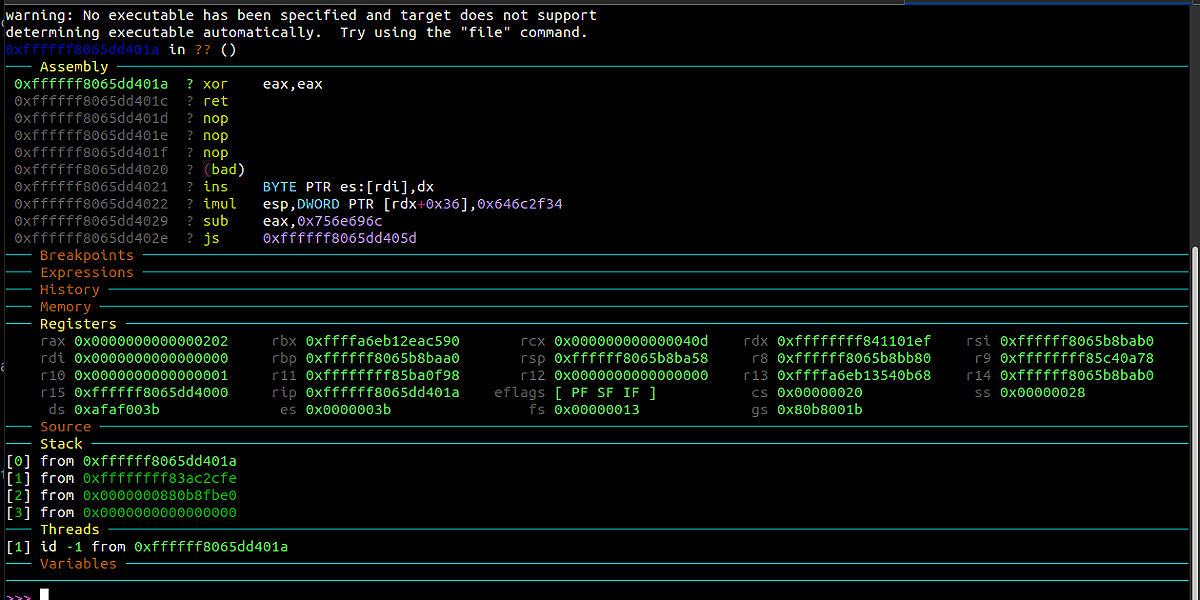
Next we start gdb and load the source file, this is what the result looks like:

So gdb is connected and we can start debugging. Our goal was to set a breakpoint at exec_self_imgact, so we need to find it's address.
In the previous klog, you see the kernel base address which in my case is 0xffffffff8394c000, and i know the slide of exec_self_imgact is 0x3CE730 (fw 6.72). So we have all we need to calculate the address to where we need to set our breakpoint.
So we set our breakpoint

At this point we can tell gdb to continue (continue command), the control is passed back to gdb as soon as our breakpoint gets triggered.
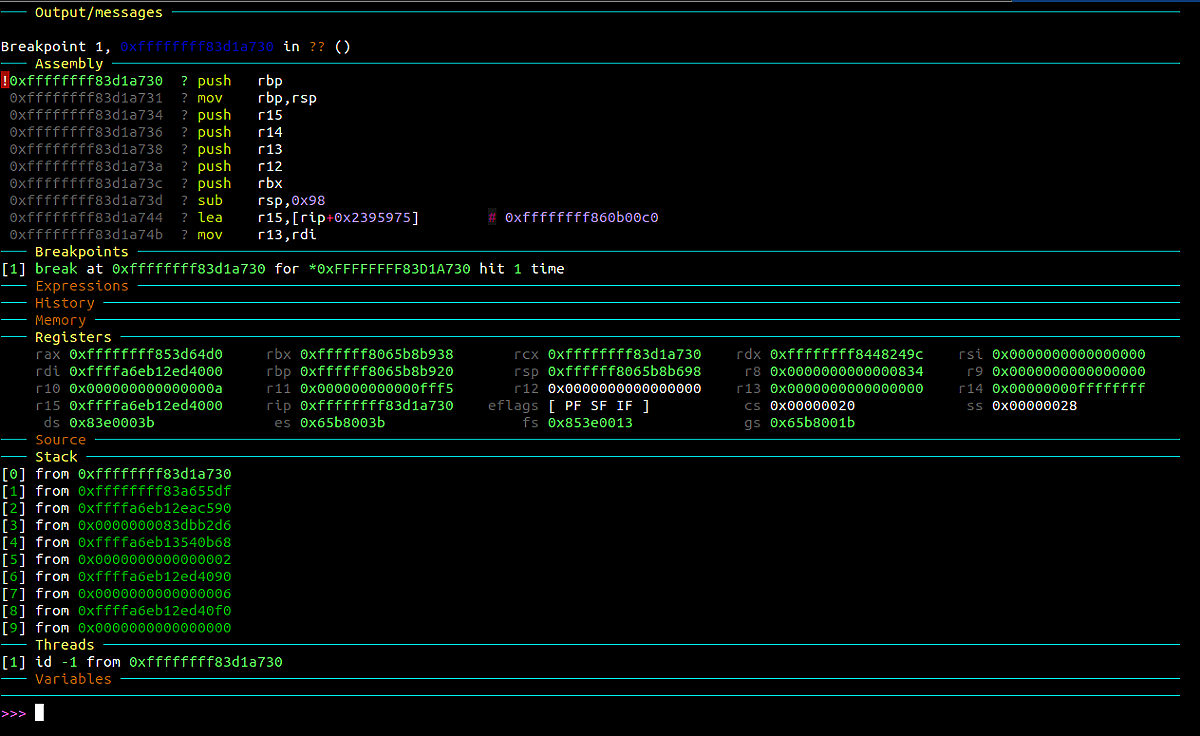
To trigger the breakpoint it should be enough to start an application, in my case Playroom. As we can see, as soon as Playroom gets loaded our breakpoint triggers and we can continue with our debugging session.

Conclusion
Debugging kernel can be a pain because of kaslr and a lot of timing and lock problems that can happen when you keep resources locked for too long. So do not expect too much from this
Have fun and don't be evil

Download: triggerRING0.bin (16.2 KB) / triggerRING0-master.zip / GIT
- PS4 Kernel Exploit Root FS Dump and List of PIDs
- FreeBSD Kernel Exploit Discovered
- PS4 Kernel ELF Loading and Hooking
- PS4 DevKit / TestKit Root Kernel Dump
- PS4 Kernel Dumped Revealing PS4 ShellUI Debug Functions
- PS4 Game Decryption / Homebrew Kernel Console IDPS Address
- PS4 Executable Files with Kernel Access
- PS4 Syscall Kernel Patch for Game Modifications
- PS4 Kernel Memory Dump with Full Kernel Symbols
- PS4KernelHooksHelper
- PS4 Crashdumps & Dumping a Kernel in Only 6 Days
- PS4 EAP Kernel Dumps
- Hacking the PS4: From Zero to Ring Zero in Two Easy Steps (PDF)
- Flexible Kernel Dumper Payload for PS4
- PS4 Kernel Loaders for IDA 7.0+
- PS4KernelDlSym Symbol Resolver / Reference Analyzer
- PS4 Kernel Fixup Script for IDA 7.0-7.2
- PS4GDB Ring 0: GDB Stub to Debug PS4 Kernel
- PS4 CR0.WP Protection Kernel Security Bypass
- PS4 9.00 Jailbreak Kernel Exploit
RING0GDB is a gdbstub that gives you the ability to debug your ps4 kernel using gdb. Like PS4GDB it's integrated into Mira and starts in the background as soon as you load Mira.
In the next sections I will show you what steps are needed to get started.
How to trigger RING0GDB
RING0GDB is automatically started during the loading process of Mira. From a technical point of view, it does not really get started, but installation happens by overwriting two ISRs (Interrupt Service Routine). We overwrite the routines for INT1 (debug) and INT3 (breakpoint).
This means that as soon as one of these two interrupts get fired, RING0GDB takes control and allows us to connect to it with gdb just like we can do for PS4GDB.
Example debugging exec_self_imgact
exec_self_imgact is responsinble for loading/starting executable files on the ps4. So our goal is to set a breakpoint into this function, and debug it as soon as it gets called by the kernel.
Like mentioned before, we must trigger one of the two interrupts. This can be easily achieved by running a kernel payload that looks like this:
Code:
int main(int argc, char *argv[]){
    asm("int $3");
    return 0;
}At this point the ModuleLoader i've added to Mira comes very handy. Because we can send this binary to port 9025 and it will start RING0GDB for us.
As soon as we send the payload to port 9025 klog should show us something like this:
Code:
[handle_exceptionRing0] remcomOutBuffer allocated at 0xffffa6eb440dc000
received interrupt 03 - errorCode: 0x0
RAX: 0x0000000000000202        RBX:  0xffffa6eb12eac590
RCX: 0x000000000000040d        RDX:  0xffffffff841101ef
RSI: 0xffffff8065b8bab0        RDI:  0x0000000000000000
RBP: 0xffffff8065b8baa0        RSP:  0xffffff8065b8ba58
R8:  0xffffff8065b8bb80        R9:   0xffffffff85c40a78
R10: 0x0000000000000001        R11:  0xffffffff85ba0f98
R12: 0x0000000000000000        R13:  0xffffa6eb13540b68
R14: 0xffffff8065b8bab0        R15:  0xffffff8065dd4000
RIP: 0xffffff8065dd401a        FLAGS:0x0000000000000286
CS:  0x0000000000000020        SS:   0x0000000000000028
DS:  0xe8afafafafaf003b        ES:   0x000000000000003b
FS:  0x0080000000000013        GS:   0x0000000880b8001b
kernelbase: 0xffffffff8394c000
[handle_exceptionRing0] gdb_stub: Entering main loop...
[getpacketRing0] remcomInBufferRing0 allocated at 0xffffa6eb273b0000

<-[gdb_start_serverRing0] gdb_start_server
[gdb_start_serverRing0] sys_socket: 0x3
[gdb_start_serverRing0] sys_bind: 0x0Like I did for PS4GDB, I've created a file (kernel.source) with the necessary commands gdb should execute at launch, the file looks like this:
Code:
set architecture i386:oops:86-64
set disassembly-flavor intel
target remote 192.168.0.2:9946Next we start gdb and load the source file, this is what the result looks like:
So gdb is connected and we can start debugging. Our goal was to set a breakpoint at exec_self_imgact, so we need to find it's address.
In the previous klog, you see the kernel base address which in my case is 0xffffffff8394c000, and i know the slide of exec_self_imgact is 0x3CE730 (fw 6.72). So we have all we need to calculate the address to where we need to set our breakpoint.
Code:
0xFFFFFFFF8394C000 + 0x3CE730 = 0xFFFFFFFF83D1A730At this point we can tell gdb to continue (continue command), the control is passed back to gdb as soon as our breakpoint gets triggered.
To trigger the breakpoint it should be enough to start an application, in my case Playroom. As we can see, as soon as Playroom gets loaded our breakpoint triggers and we can continue with our debugging session.
Conclusion
Debugging kernel can be a pain because of kaslr and a lot of timing and lock problems that can happen when you keep resources locked for too long. So do not expect too much from this
Have fun and don't be evil

